The Inspector Pane
This pane is very similar to the web inspectors found in browsers such as Chrome and Firefox. Access a DOM tree of all the page elements and view CSS configurations.

This pane is very similar to the web inspectors found in browsers such as Chrome and Firefox. Access a DOM tree of all the page elements and view CSS configurations.

Watch an overview of the Inspector Pane and learn how to work with the elements in the DOM tree, use the search control, and view the CSS markup.
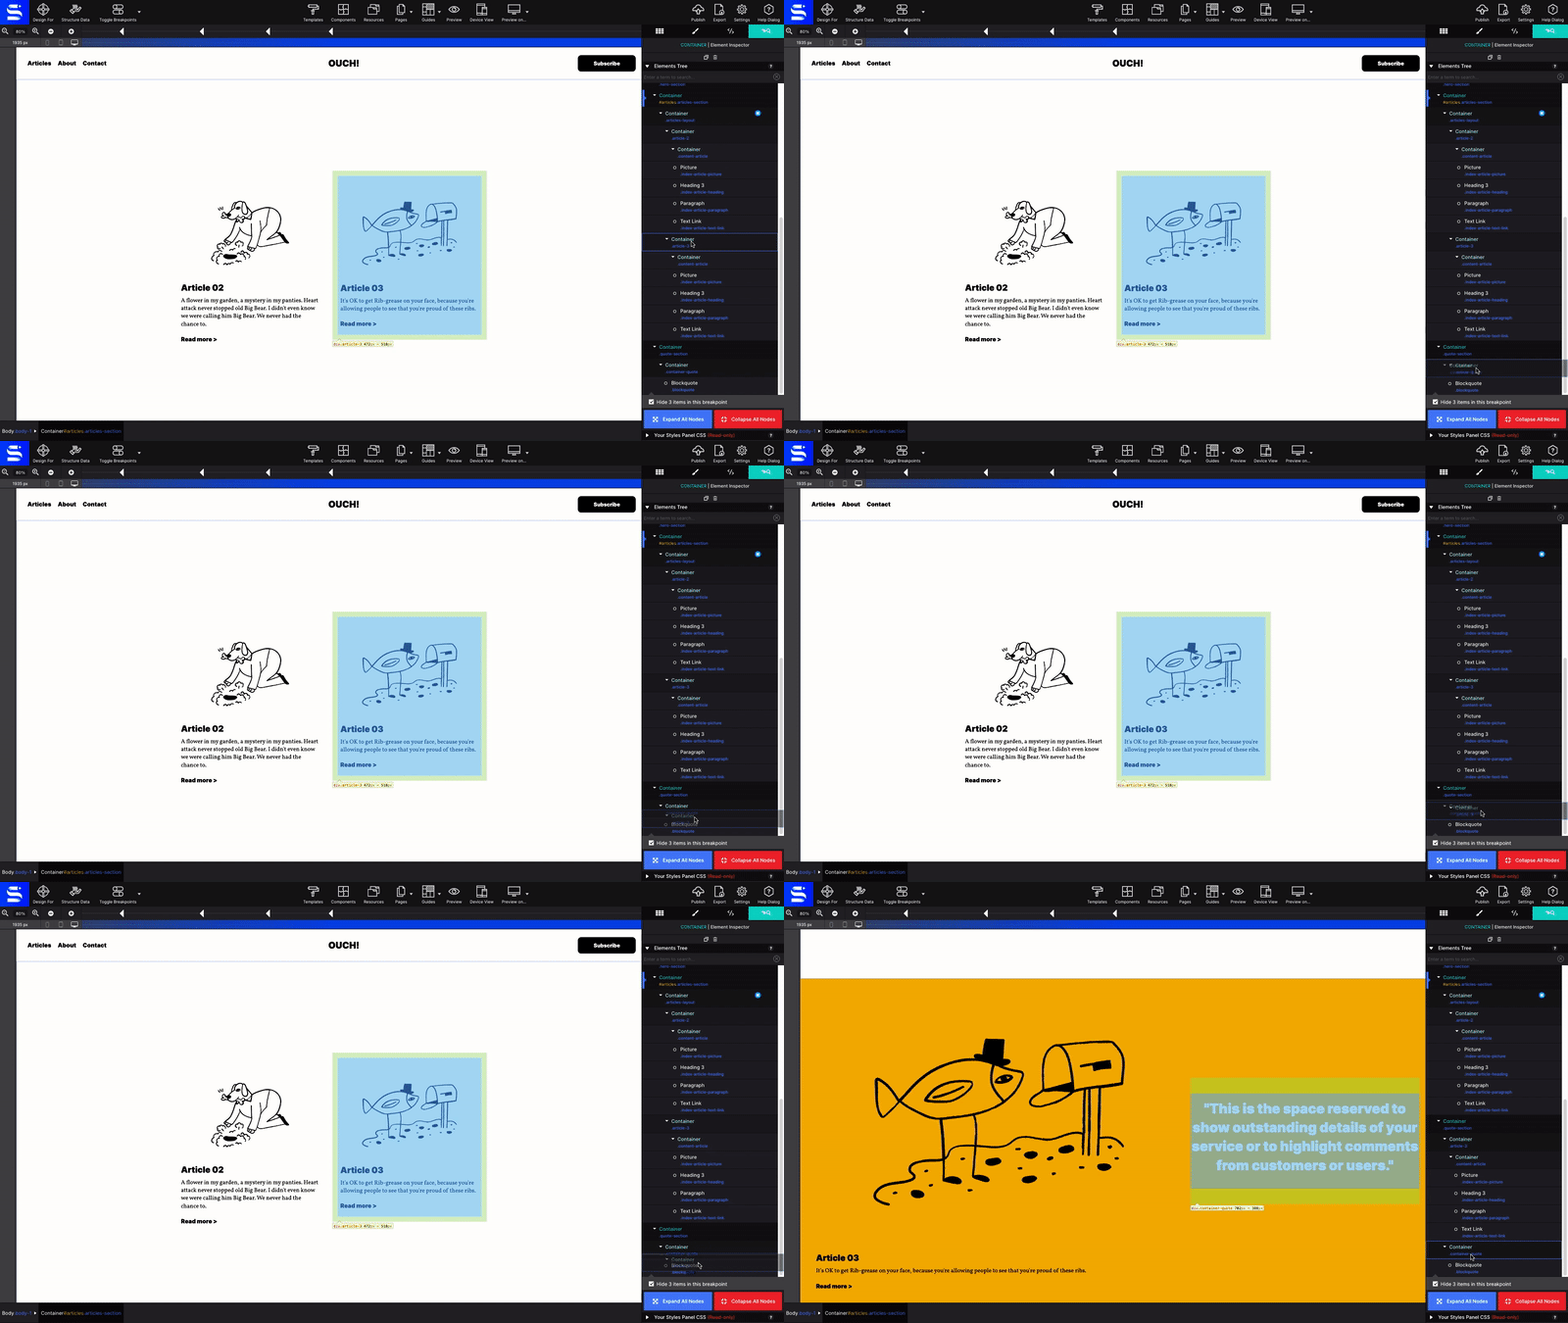
The top half of the Element pane shows the DOM tree; a list of the page elements and their nesting. Mousing over an element highlights the element and shows its selector and dimensions on the canvas. The element itself is highlighted with the blue / gray color, and margins are displayed using the rose colored area.
Elements can also be selected and moved to other positions. When selected, the canvas scrolls automatically to the element position. Double-clicking the element will bring up the Styles pane for that element.
To move and element or element group, simply click and drag. While dragging, a gray indicator bar will represent where the element will be placed when dropped.

All the duplicate and copy and paste functions work when an element is selected in the tree. For example, the keyboard shortcut CMD/CTRL+C will copy it. Then select the element where you wish to place it and use CMD/CTRL+V to paste it (or use the right-click menu).
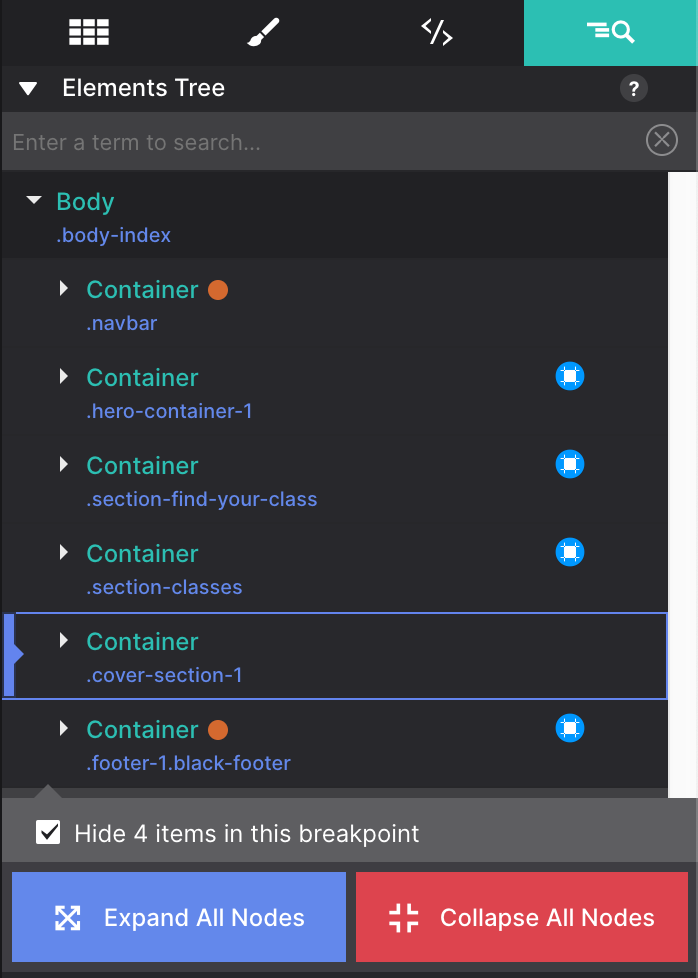
Element groups — containers and link containers — can be collapsed by clicking on the arrow to the left of the element title. You can also choose to Collapse or Expand all the nodes at once.

The orange dot next to an element signifies that it acts as a symbol — updates to a symbol will trigger down to all instances of the 'symbol element group.'
Locate a class or element fast by keying in the term into the search. The app will bring up all the items that are a match and will highlight them on the canvas.
Elements or element groups are not always visible to the visitor and therefore also not always visible on the canvas. Examples include mobile menus that slide into view, accordions of which only one container is visible at a time, modal dialogs...up to simple dropdown.
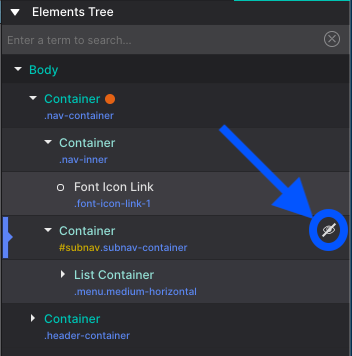
The strike through the eye icon next to an element in the tree indicates whether it is hidden on the canvas at the current breakpoint or state.

To show a hidden element — so it can be styled — just click on the icon. It will change to an eye and the app will override the styles that hide the item. You can also do that for all elements on a page by clicking the 'Show x hidden item' toggle at the bottom of the pane.
A mobile menu for which the visibility is toggled on and off.
Please note that under certain circumstances this may currently override applied positioning styles such as flexbox. This happens only when the eye 'forces' the visibility and will not happen for the published or exported site.
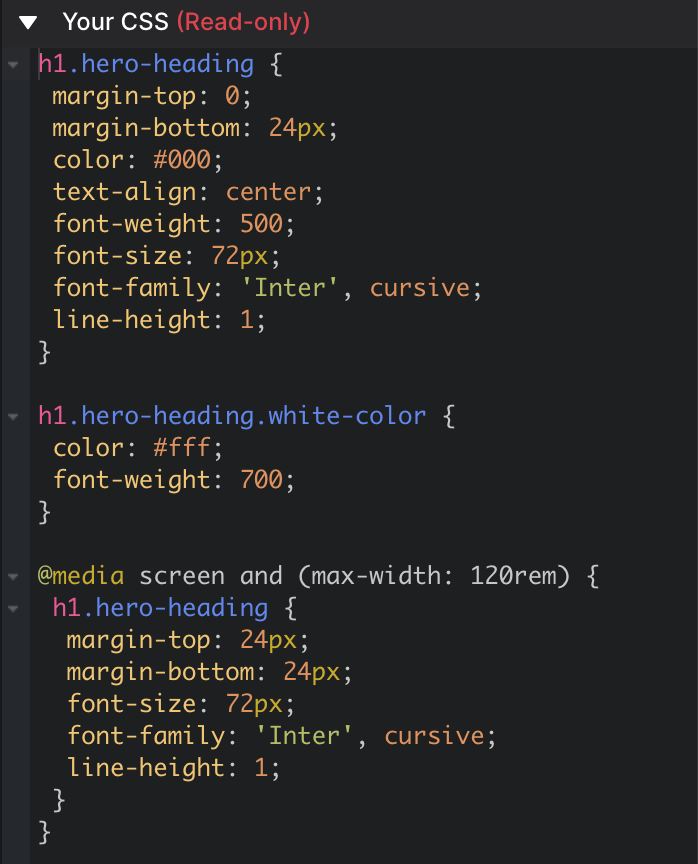
The CSS that is applied to the selected element is visible in the bottom half of the inspector pane. By providing the CSS applied to the selected element at all breakpoints, the inspector gives you a sense of exactly what is going on "under the hood".

View all of the CSS styles applied to an element
Read-only or editable? We do have plans to add the ability to edit the CSS live. To help us prioritize our development work, please let us know how important you find this by leaving us a note in the forums. Or just hit us up on Facebook or Twitter!
Share and get help from out community.
We’re available Monday - Friday